How to Check Your Server Resource Usage
In this guide, we will show you how this can be managed.
The first step is to go to Scalacube.com and log in to your account.

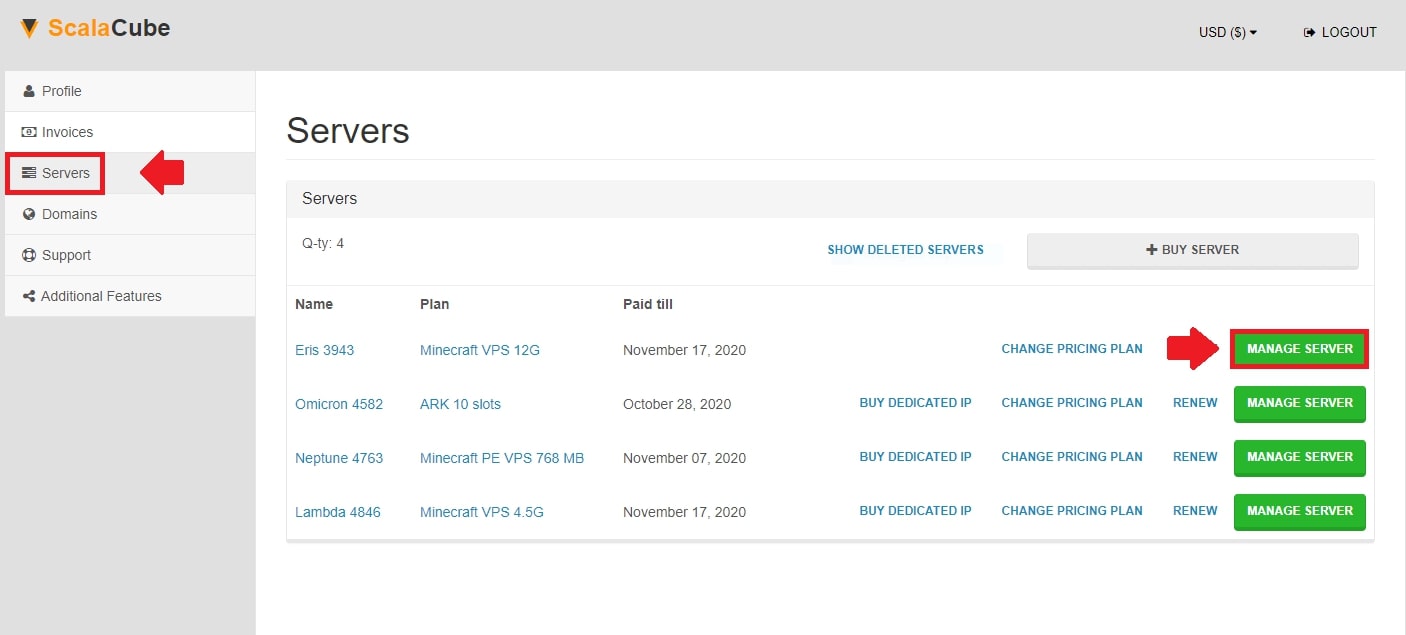
Next, click on "Servers" and then "Manage server".

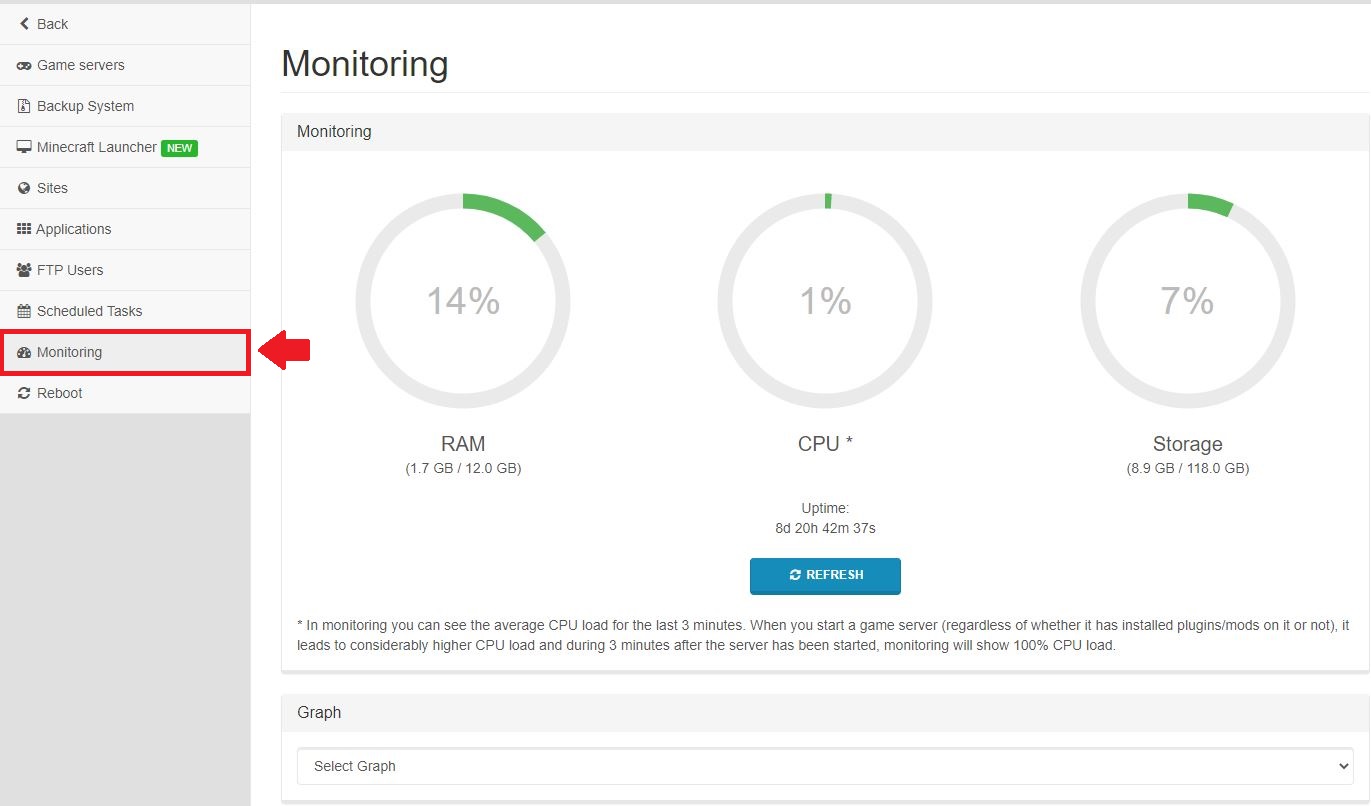
Now, find "Monitoring" on the left tab of your Scalacube control panel.

Here we can see the resource graphs for your server.
It includes RAM, CPU, Storage, and Traffic graphs.
For a more detailed look, we can select the bar below and see for example RAM to see how much resources we are using for that selection at the given point and time. We can also click "Refresh" so that the graph would be updated to the latest information.

Congratulations! You now know How to Check Your Server Resource Usage.
Summary:
- Log into the Scalacube website and go to your server control panel
- Click on Manage server > Monitoring
- View servers resource usage and plan accordingly
Make Your Own Minecraft Server For Free
Your own Minecraft server is only 5 minutes away! We support simple one click install for over 1000 unique modpacks.
Start Your Server For Free!